So I tried the older 10 and 20 (Month just 20) for a more trend perspective
Sure can see why USDJPY traders are fighting, all YEN cross are UP and UJ seeking to go DOWN


 |
 |

So I tried the older 10 and 20 (Month just 20) for a more trend perspective
Sure can see why USDJPY traders are fighting, all YEN cross are UP and UJ seeking to go DOWN
Thanks for sharing but it is not clear for me or maybe I'm not understanding, there are 7 Blocks for settings but you provide 8 parameters?
1) 50 MA on M1
2) 21 - 35 MA on M5
3) 21 - 35 MA on M5
4) 21 MA on M15
5) 12 MA on M30 - H1
6) 12 MA on M30 - H1
7) 5/12 MA on H4
8) 5/12 MA on H4
1 - M1 - 50 MA
2 - M5 - 21 MA
3 - M5 - 35 MA
4 - M15 - 21 MA
5 - M30 - 12 MA
6 - H1 - 12 MA
7 - H4 - 5 MA
8 - H4 - 12 MA
I assume the MA means the conventional parameter of Simple Moving Average of the Close Price
That 5 / 12 reminds me of another analysis that uses that, give me a notion!
Perhaps a screenshot of the settings would be simple if you own SnagIt or some thing similar to that
Cheers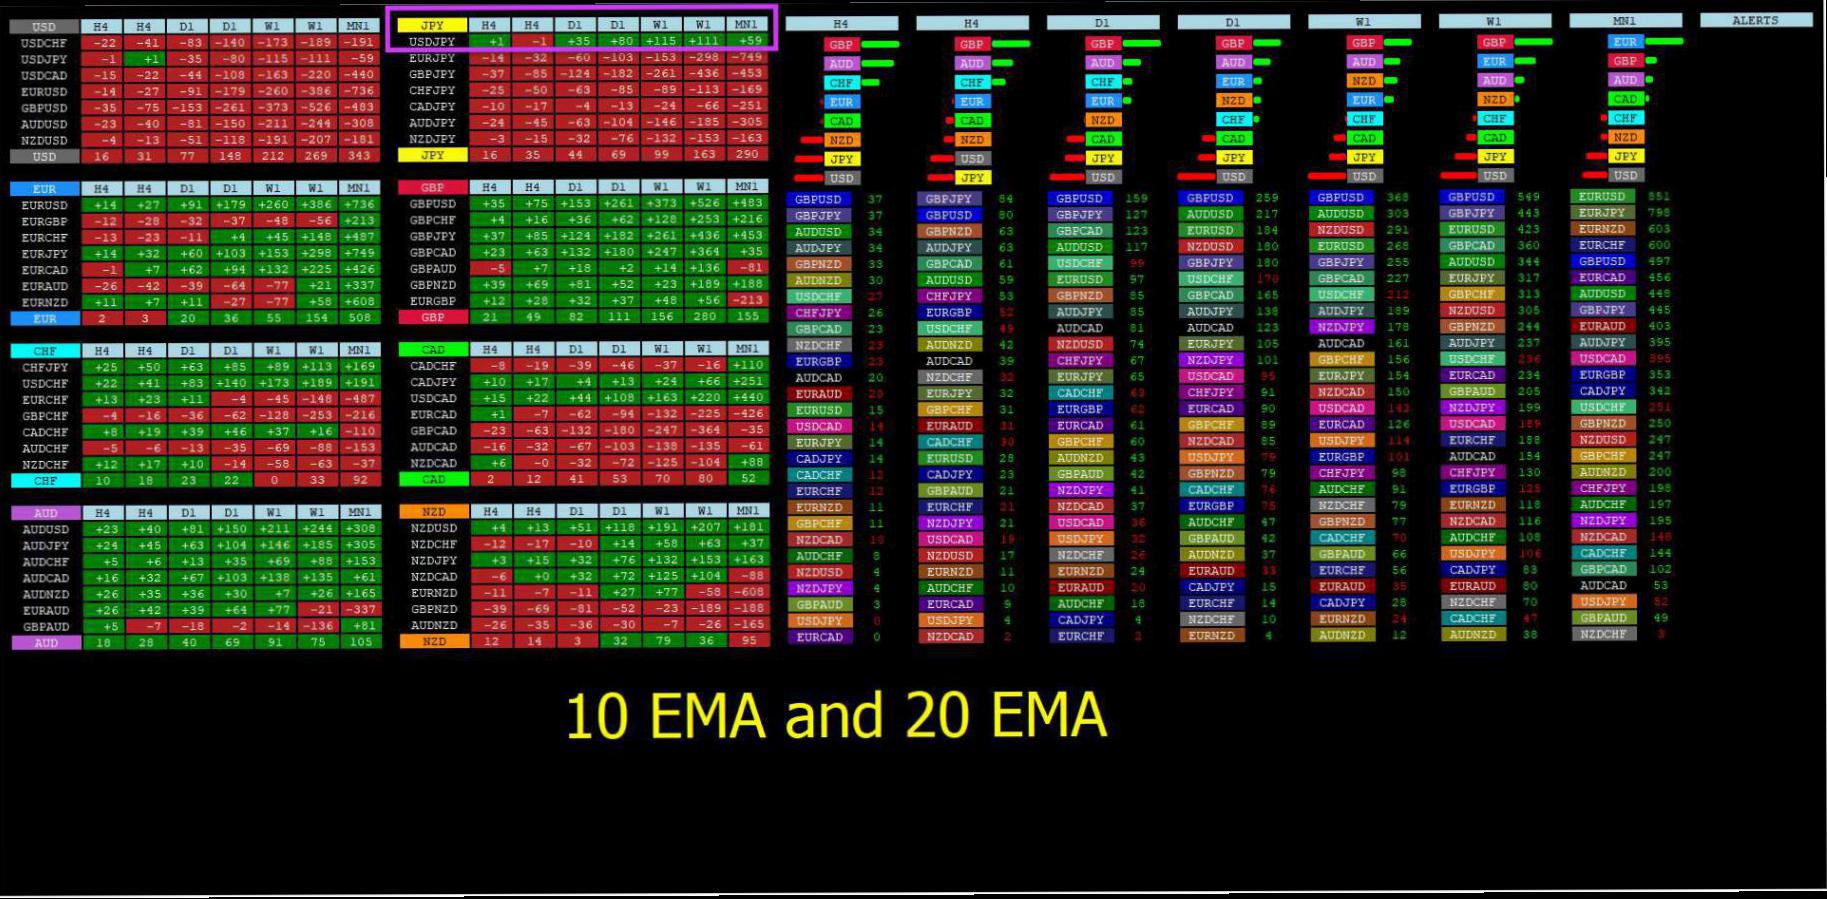
Hey ,
50 MA on M1, 21 - 35 MA on M5, 21 MA on M15 and 12 MA on M30 - H1 and 5/12 MA on H4.
Cheers
Already got it. Thanks :-)
Hi George,
Since last couple of days, reading all your articles in page 1 and today reached @ page 36. Only a question,
are you still using attached indior for recent signs? If so, can you please let me know any particular key word to search on Stevehopwood forum? I tried to hunt in Manual Trading but could not find this. Thanks in advance

I just remembered I return to this thread since I was searching for an indior which would show a print of how many pips price was away from the current MA
And if it could show the Maximum it had ever been away ( x number) from the MA which will be an incentive; could this indior exist?
It would work sort of like an ATR indior so it do display for all time frames
I believe it would look something like that:
Heading : 20 EMA
Lookback : 100 bars
Current Distance : 31 pips
Maximum Distance : 102 pips
It wouldn't give any sign or perhaps guarantee price would go back into the MA, but more of an alert that price was far away, sort of like Bollinger Bands
Due
Can you share the rest of the settings please? Some type of Fibonacci collection of numbers, or what's the theory?
You appear to be the greatest here and many consistent user.
I knew that EURCAD was arriving back; another indior gave a buy signal on this external bullish 4 Hour candle but it was 4am shut for me.
I've got solid RED on NZD now 1-1/4 hours before Frankfurt opens, nearly all RED on JPY too
With USD mainly GREEN with AUD and GBP close behind
Could be a large session
Hey ,
I do not use the same MAs on all time frames. I use numbers on the more compact and TFs MAs on the TFs. On the M5 TF, I utilize the 21 LWMA channel of low and high.
This was the picture at the Start of the US session.
I have a display dedied to this dashboards, and utilize an auto screenshot program to take screenshot of the dashboards each 10 minutes
Looks like market EURCAD for USA session (I'm re-reading the thread, any hints for what MA settings everybody is using)
I'm trying 20 EMA as that is return to imply price everybody utilizes

Hi Kashif,
Yes the currency slope power does exist and There Are Lots of versions of these like on FF, and on SHF http://www.stevehopwoodforex.com/php...hp?f=101t=4888 look for BALUDA'S SUPER CSS-2.0.
Unfortunately you can't replie my trade as I'm not a sign services.
Cheers, and all of the best.


 Reply With Quote
